What to measure in a smart home
Measuring data in your home can become somewhat addicting: How much energy did my solar plant generate? How much gas did my heating system use? How is the humidity in my rooms?
Here I want to give an overview of the things I am currently measuring in my home.
How do I measure
For most historicized data I use Grafana in combination with InfluxDB. Most data is dispatched through my Iobroker instance to InfluxDB - and collected via MQTT (ESP projects such as gas meter, flow and return temperature), Modbus (Sungrow inverter) or Zigbee (Aqara sensors). Some proprietary devices such as the smart plug with energy meter or the garage door opener are connected via dedicated extensions.
Solar
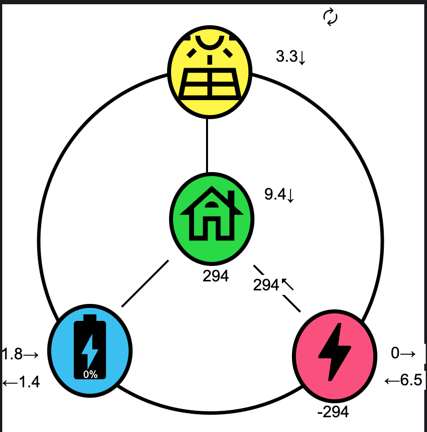
For owners of solar power plants some kind of data and analyzing is part of the fun: Most inverters offer some kind of app driven analytics. In my case, however, I wanted to have an overview that is more “real-time”, so I connected my inverter via Modbus with my Iobroker(german) instance. The visual representation still leaves room for improvement - but the data is almost real-time.
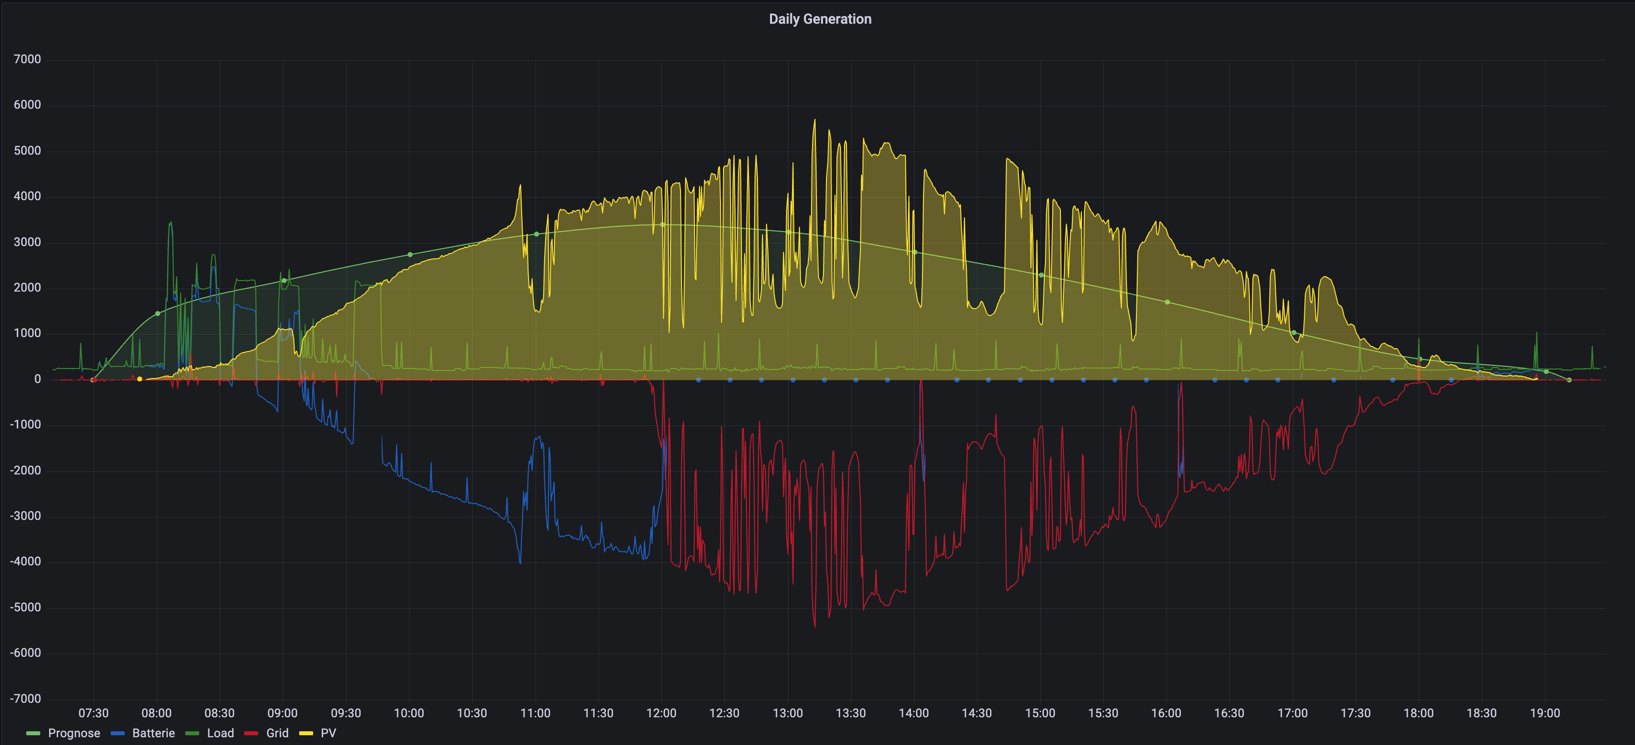
Another typical analysis is the following chart: It shows
- generated energy
- energy needed
- battery charge/discharge
- export/import from/to grid
- solar forecast
By using negative values for grid exports and battery charge the overall chart still is kind-of-readable and gives a good indication at which times a lot of energy was needed and when e.g. the battery was empty or energy was bought from the grid. And the solar forecast gives you a reference a model on top to understand if you had a good or bad solar day.
Heating
Alongside electricity, gas for heating is an important cost item to keep an eye on. I have mainly three data points I control.
Gas consumption
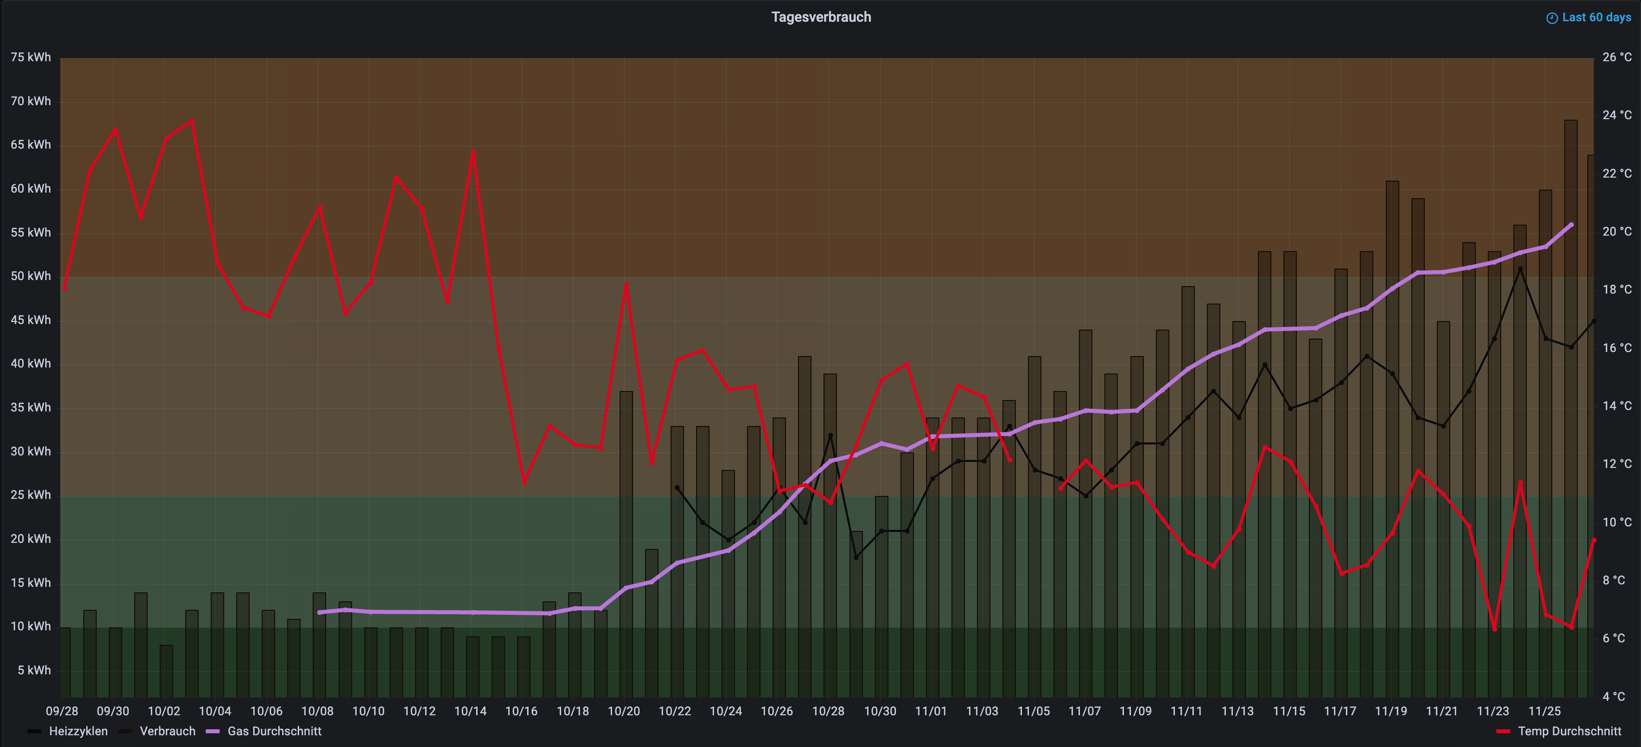
I am reading my gas consumption with a simple compass sensor(german). This way I am easily able to control my daily gas consumption as well as the monthly data. Over time, I added more and more details to the chart - currently it shows the following data:
- daily gas consumption (grey bars)
- 10-day-rolling-average gas consumption (pink)
- daily temperature average (red)
- number of heating cycles (black line)
Flow and Return
Another information I was interested in, is the flow and return temperatures of my heating system: The whole heating system was originally layed out for flow temperatures of 75°C and above. For the heat pump, I eventually want to install, it is relevant to reduce the flow temperature as much as possible and check if you can still heat the house with it.
Furthermore, the number of heating cycles (i.e. how often the gas heater needs to start) is interesting to get an impression how efficient the overall system runs: If the gas heater has a lot of heating cycles it most likely does not run very efficient and the heat pump can be layed out undersized in comparison to the gas heater. The heating cycles are basically measured by counting how many times the flow temperature sunk below a given value (e.g. 35°C) and then went up to over 45°C again.
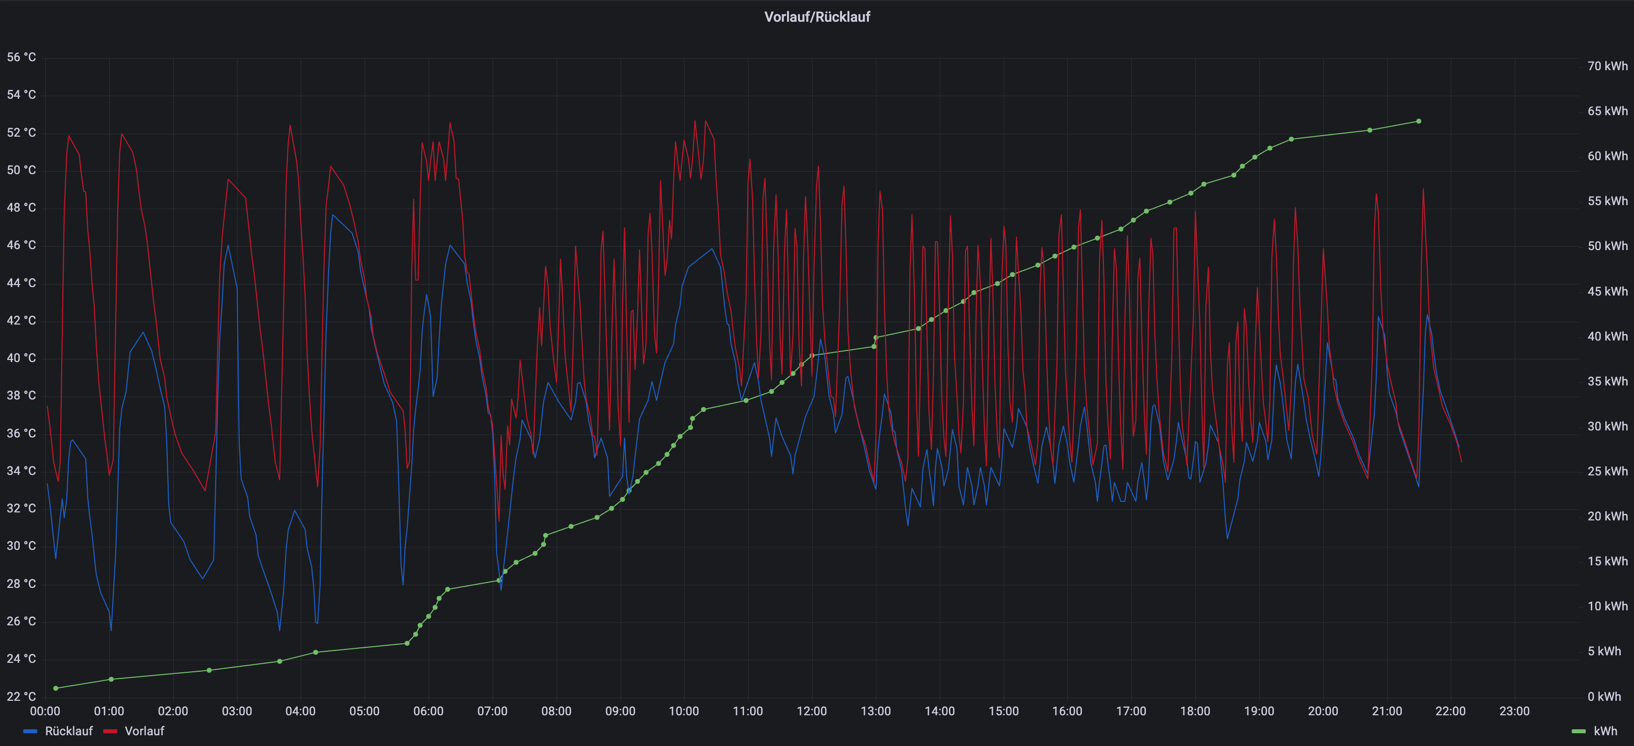
In the above case I observed that the flow temperature usually does not exceed 50°C - which indicated that running a heat pump might very well be possible as generally it is said that heat pumps can be run quite efficiently if no more than 55°C flow temperature is needed.
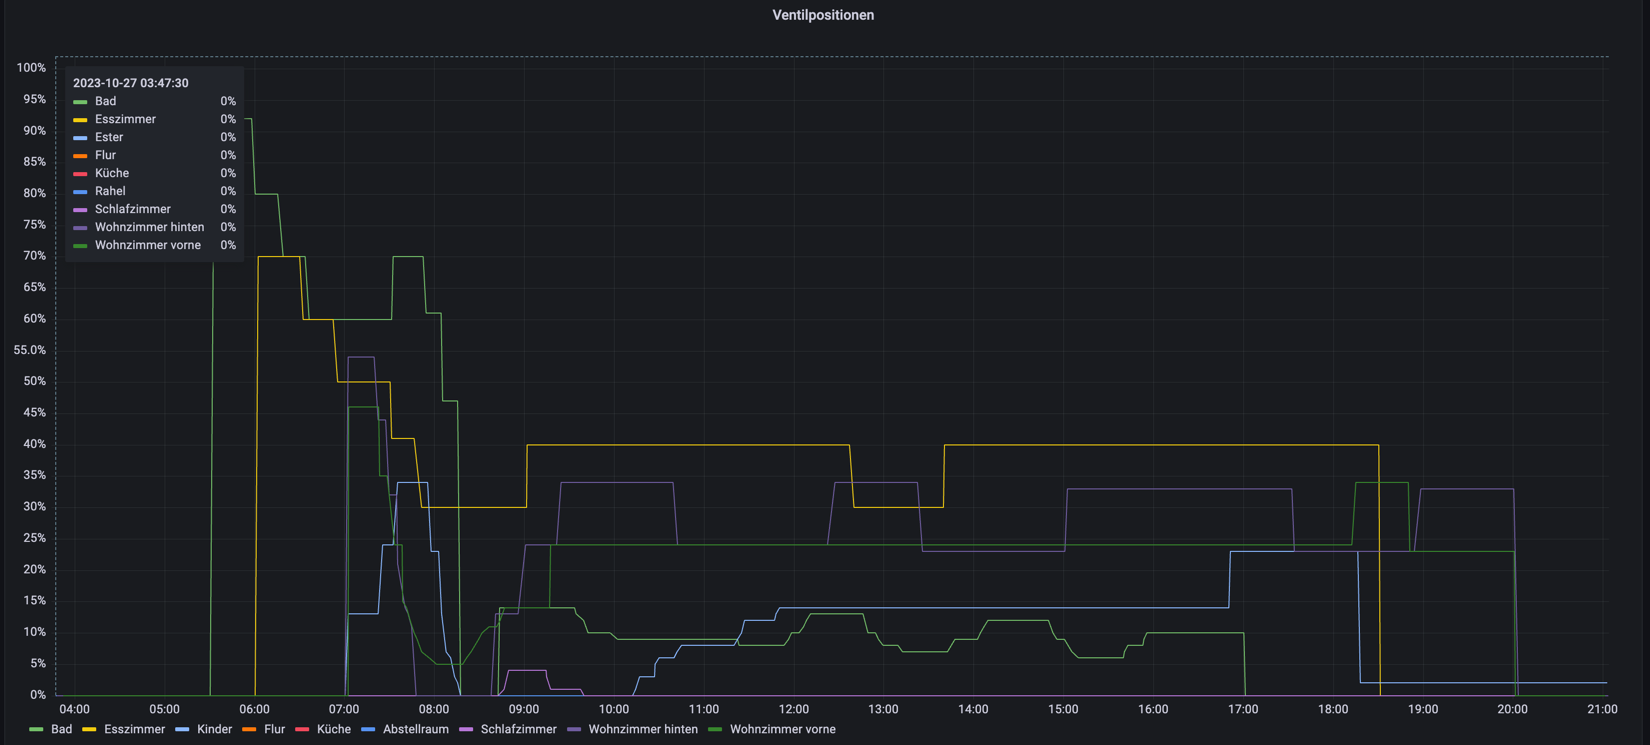
Valves
Another analysis I like quite a lot is the valve position of my smart thermostats: They show a percentage value which indicates how far open the valve of my radiators were at any given time. This way I have a rough indication in which room the heating energy was needed and when. This again helps me to understand in which rooms the size of the radiators is over- or undersized or just right. A constantly 100% opened valve could be an indication that a radiator is undersized - and most likely needs to be replaced if the flow temperature is decreased further.
Not fully automated (yet)…
…is my regression model for gas consumption(german). It is some sort of reference model what gas consumption can be expected in a given month based on the average temperature.
Rooms
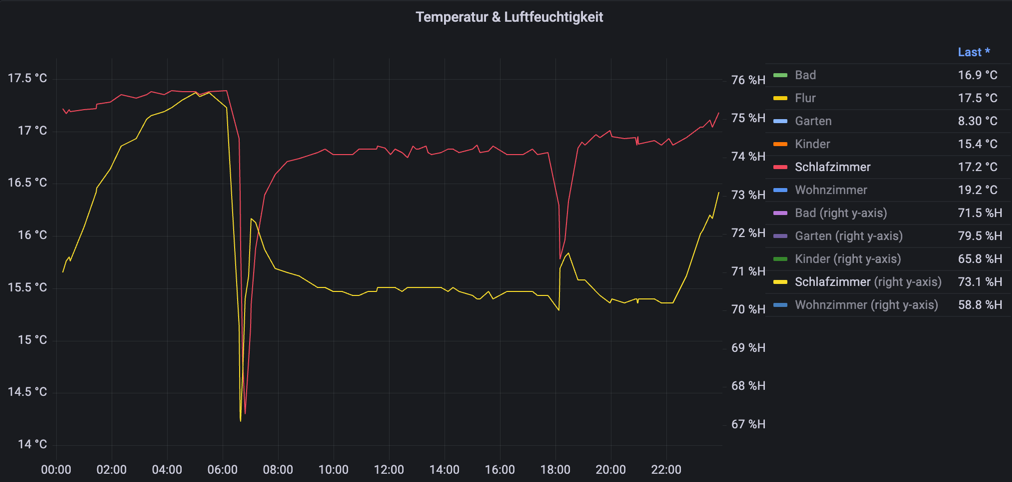
Temperature & Humidity
A classic overview is the temperature and humidity chart. Especially in insulated older houses it is important to keep an eye on the humidity - and for ventilation it is relevant to compare outdoor and indoor temperatures and humidity.
Obviously it would be too cumbersome to check and calculate the temperatures and humidity for every ventilation of the rooms - so there is the lamp below in place - that automatically turns red if ventilation is not recommended and green if ventilation is recommended.
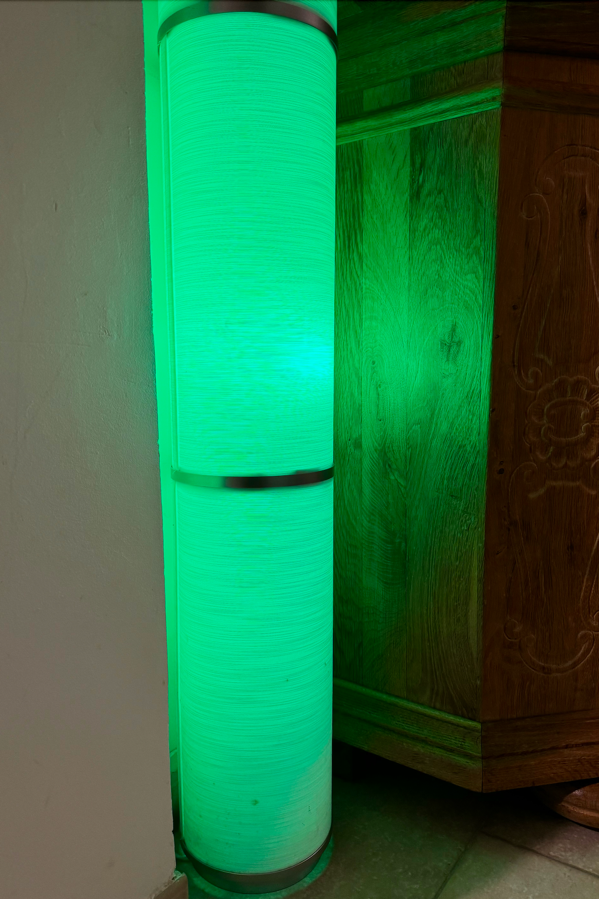
If ventilation is recommended or not is calculated with the following “rule-of-thumb” formula:
\[ \text{Humidity}_{\text{Outdoor}} - 3 \times (\text{Temp}_{\text{Indoor}} - \text{Temp}_{\text{Outdoor}}) < \text{Humidity}_{\text{Indoor}} \]
Other
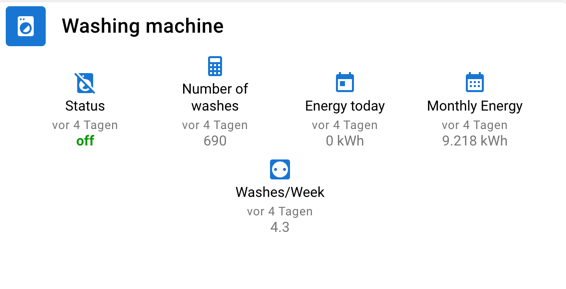
Washing machine
A simple overview of number of washes (total and per-week) as well as daily and monthly power consumption.
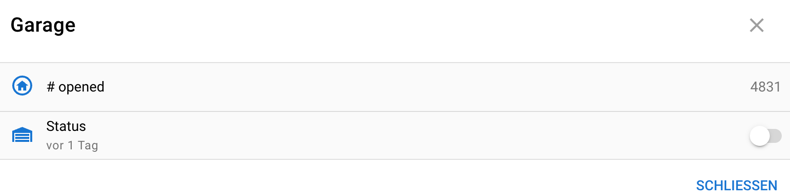
Garage
Probably least relevant - but still I think it’s interesting that we opened our garage 4831 times in shy over 3 years.